TINTIN Project: Progress on Panels
The TINTIN Project in my lab is gathering data about the structure of comics from around the world. We’re aiming to analyze 1,000 comics from over 75 countries. To do this, my postdoc Bruno Cardoso and I designed a fancy software program called MAST (the Multimodal Annotation Software Tool), and once we have gathered the data we’ll be looking for cross-cultural patterns and seeing if those patterns might relate to the spoken languages of the comic authors.
We’re less than halfway into our data gathering, with 442 comics uploaded to MAST, and 285 comics now analyzed in various ways. So, now’s a good time for a little progress report with some basic findings so far…
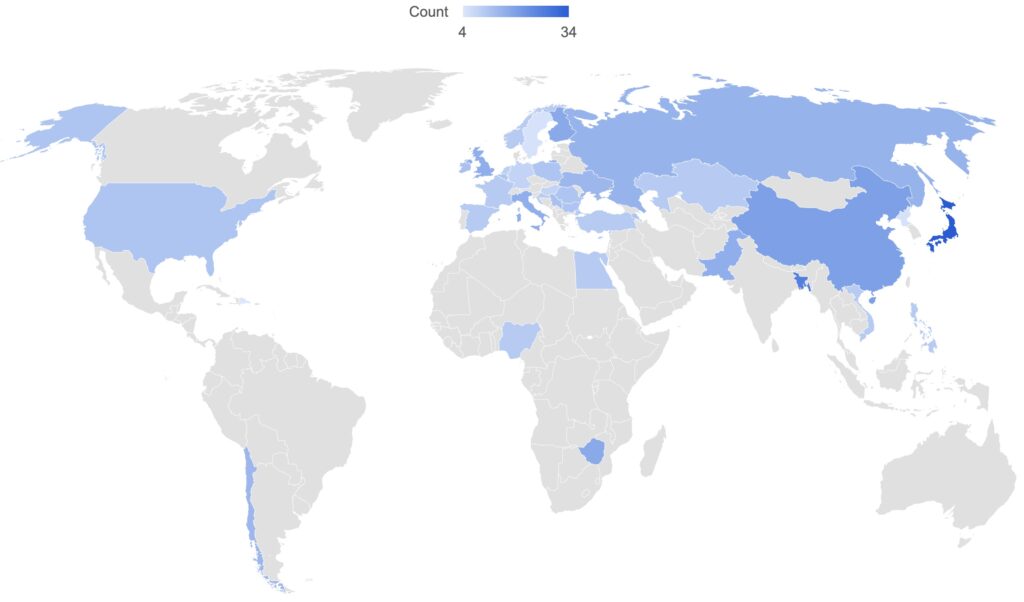
We currently have comics from 36 countries represented in the corpus. As you can see in the map, this spans across the globe. We spent the last several months focusing on comics from Europe, so that’s why it’s more full than other locations. However, we have already gathered a lot of comics from all over the world, so we’ll be filling in other parts of the map soon.
Within our 285 comics now analyzed, let’s just look at some basic findings about pages and panels.
So far, we’ve analyzed roughly 4,200 comic pages, with roughly 21,600 panels. On average, We’ve found roughly 5.4 comic panels per page.
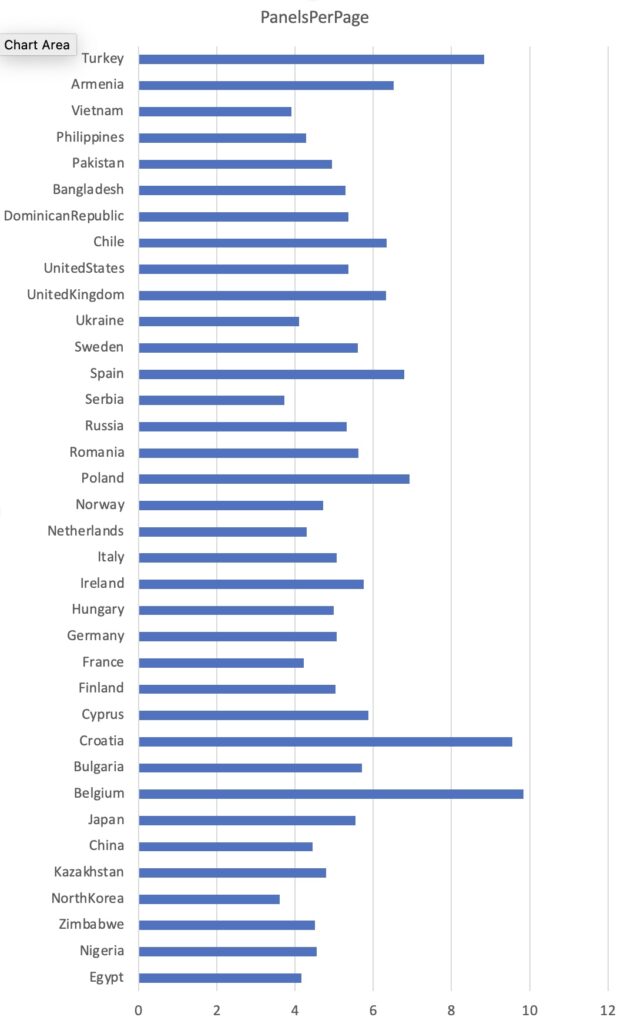
If you break this down by country, you get the values in the chart to the right. As you can see, there’s a wide variety of average numbers of panels per page, but most are hovering around between 4 to 6.
We can also average across these individual countries to characterize the average number of panels per page for global regions. This is only one of many ways you can cut up this data. You can also look at it across publication date of the comics, or the general style (ex. manga vs. superheroes), but for now this can provide at least some interesting observations.
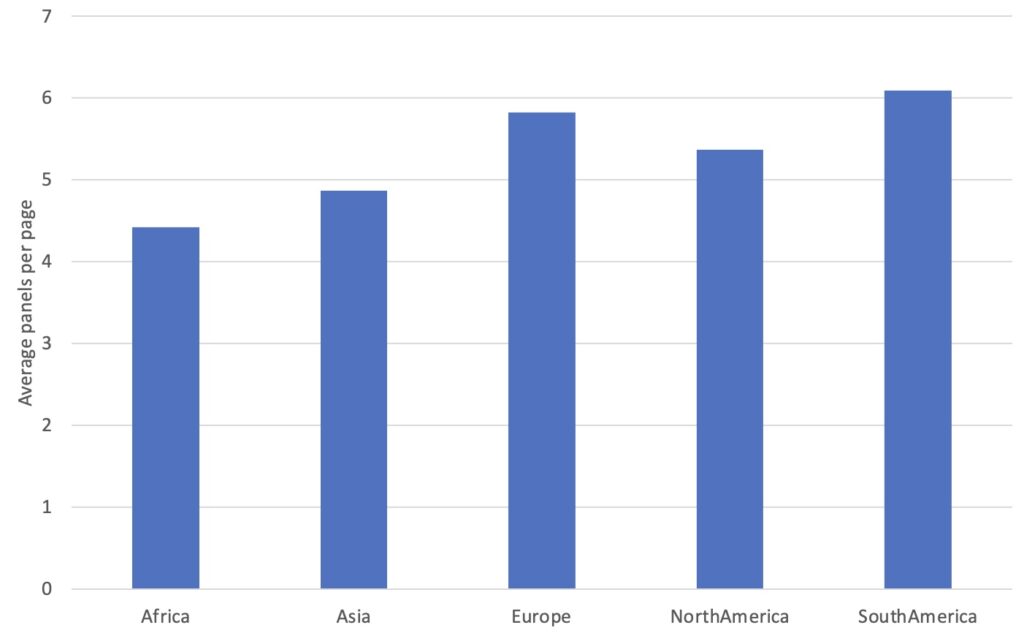
Here are the averaged panels per page for each region. As you can see, Asian and African comics have the fewest panels per page, and those from Europe and South America have the most.
These averages are actually consistent with our prior work analyzing comics layouts.
In our older research, we only counted the frequencies of panels. With MAST we visually select the panel before annotating it, and this gives us data about the size and shape of the panel too. To compare across comics that might have different page sizes, let’s look at the relative size of the panel. This is the percentage of the page that a panel takes up. So, for reference, if a page used four panels, you’d think each one would occupy 25% of the page… but there’s also space taken by gutters and margins. So we can estimate it’s maybe closer to 20% for each panel in this case.
This graph shows both the average size of all panels on a page, and the relative sizes of the first panel of a page.
Overall, panels occupied roughly 17% of the page, but first panels occupied roughly 22%. So, interestingly, first panels are bigger than the average panel size.
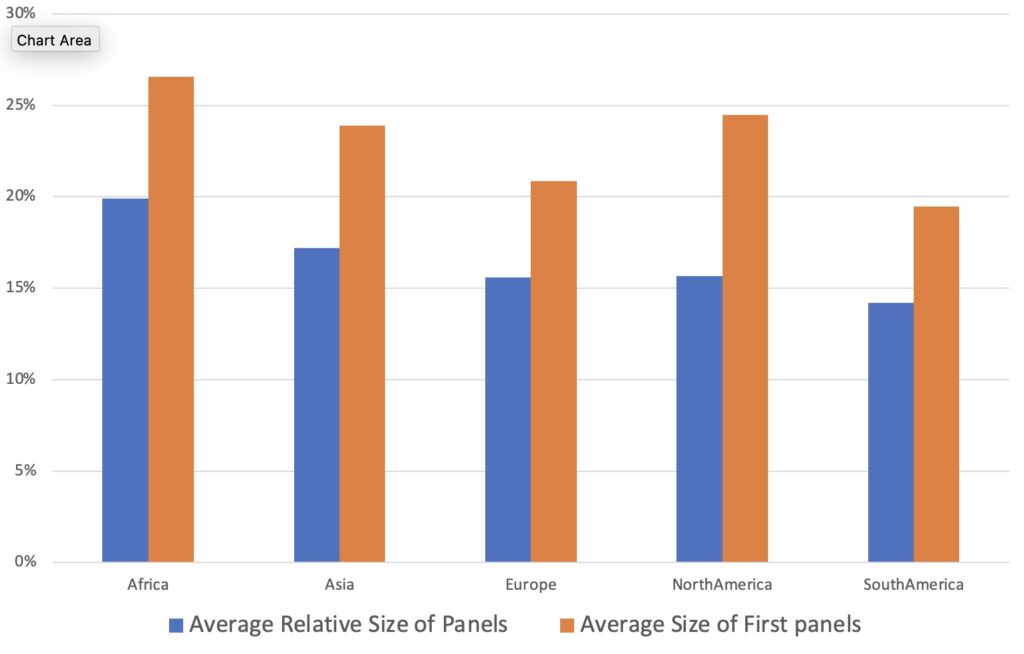
You can also see in the graph that the sizes of panels differed across regions, and first panels are consistently larger than the size of all panels, often to a fairly large degree. These cross-cultural differences make sense though, since fewer panels on a page would presumably mean that you can fit larger panels on it (and vice versa).
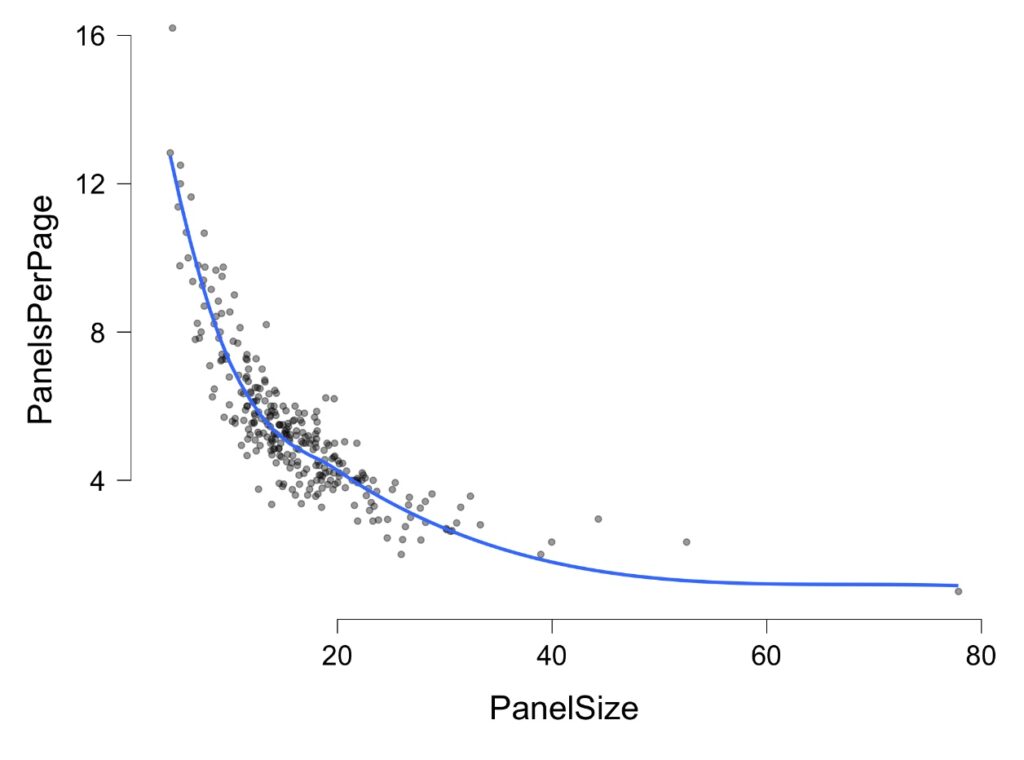
This tradeoff is exactly what seems to be happening. Here’s a graph comparing the average number of panels per pages for each comic in our corpus compared to the average size of panels. As you can see, more panels mean smaller sizes, and fewer panels means larger sizes.
So, these are some fun basic results so far. Ultimately, these constitute only about a quarter of the total comics that we’ll be studying in our project, and I’ll update more about further progress and some of the more abstract things we’ll be analyzing.
Comments