TINTIN Project: MAST
Our data collection on the TINTIN Project is now underway! If you’re not familiar with it, the TINTIN Project is our current research project aimed at analyzing the cross-cultural patterns in comics from around the world. We’re analyzing the structural properties of comics from over 60 countries to look for patterns, and to see whether those patterns might be similar to those found in spoken languages.
Much of our data collection is progressing in a semester-by-semester basis with help of students at Tilburg University and our global collaborators. Our lofty goal is to analyze 1,500 comics. Our first batch of data has now been analyzed from last semester, and we have a long way to go!
We’re analyzing comics using our new software tool we call “MAST” which is the Multimodal Annotation Software Tool. With it, you can respecify classifications that you might want to analyze in a document. Within documents, like a comic page, you then select a region, and can assign that annotation to the region. You can also establish relationships between annotations, such as to specify the standard reading order of a comic page or connect all instances of a character throughout a book.
One of the really fun things about MAST is that it gives us a lot more sources of data to analyze than our previous analysis methods. In our Visual Language Research Corpus Project, we had analyzed 300+ comics from about a dozen countries in North America, Asia, and Europe. We did this just using Excel spreadsheets, mostly with panels as our unit of analysis. This gave us basic frequency data for how often (mostly) panel-level patterns occurred in these comics.
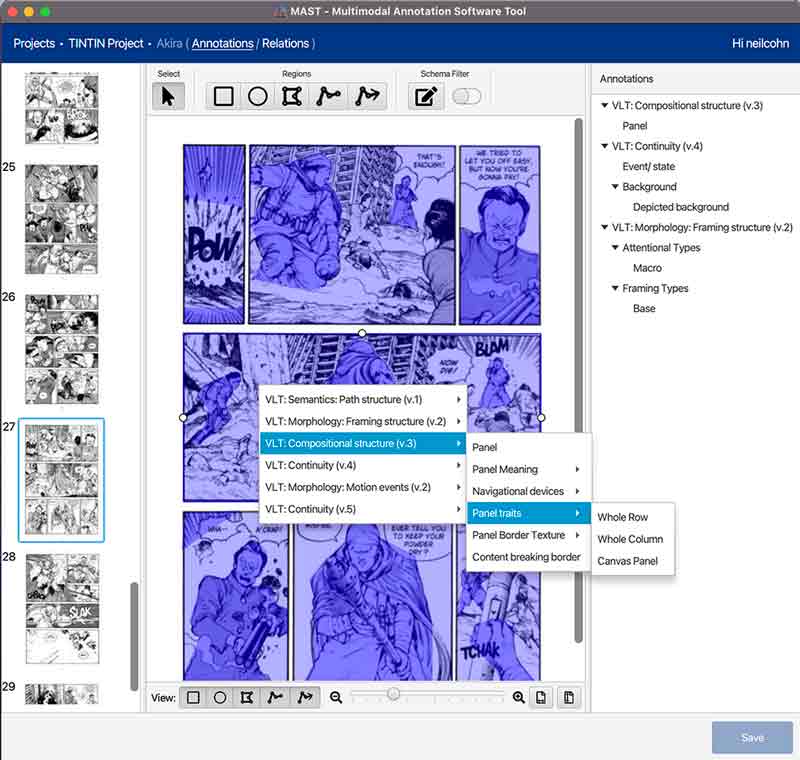
With MAST, we can select any size unit we want. It’s not just panels, but regions smaller than panels (like characters or symbols) or spanning across panels. We can also add regions for things like vectors reflecting the way a character is oriented or the direction of their movement. Because it’s all visual, we can analyze both the frequency that things occur in comics, and their sizes, shapes, orientation, position, etc.
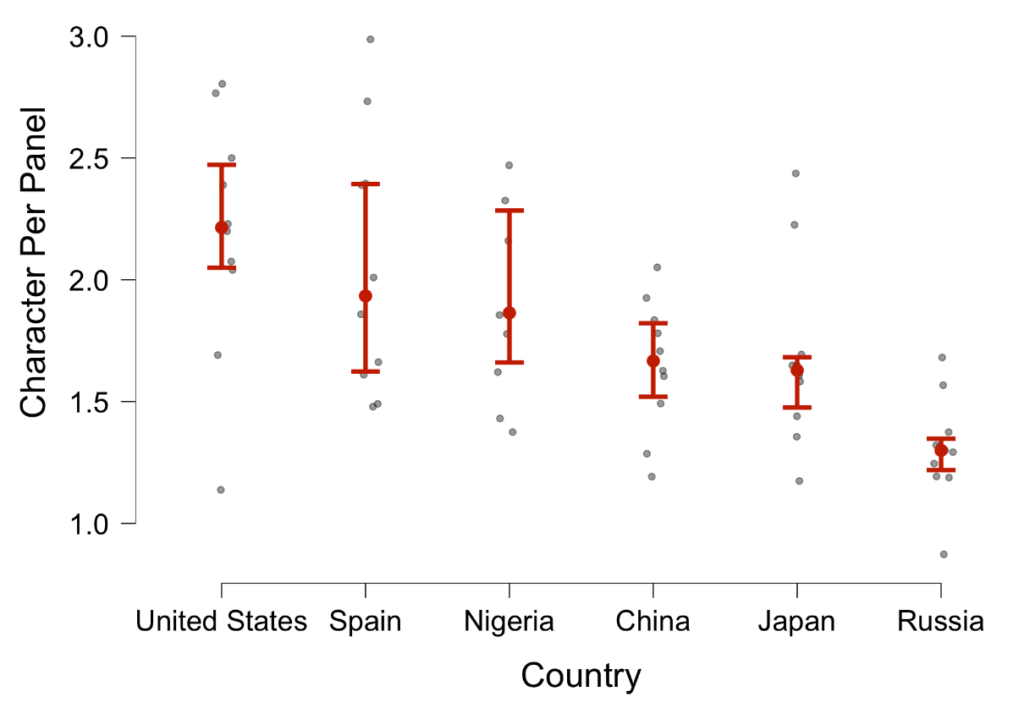
For example, one of our classifications examines the number of characters that appear in a panel. Using this metric, we can first ask questions like whether cultures vary in the average amounts of characters per panel. In a small sample form our corpus so far (around 60 comics with roughly 900 panels), it turns out they do!
But, we can also ask whether the number of characters per panel affects its size. This would be logical, since presumably you’d need more space to fit more characters. It turns out this is also the case in our small sample:
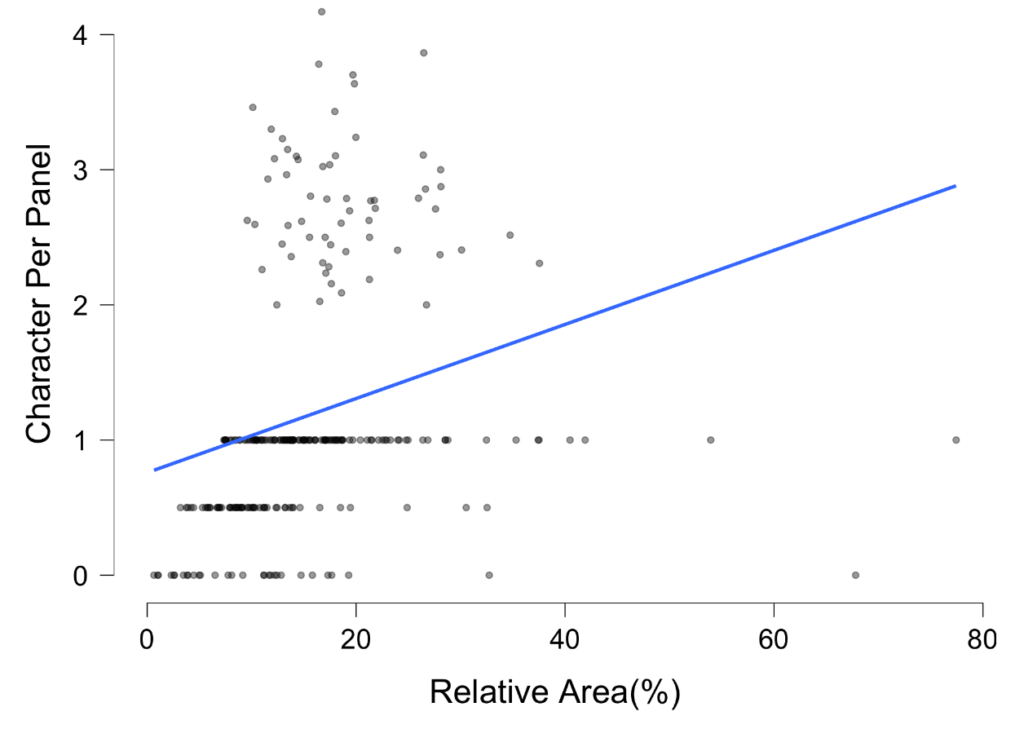
But, it seems things are a bit more complicated, as you might notice in that cluster of dots above the trend line. Many panels only contain one character, or use less than one character, like in a close-up (we give these a value of “.5”), which result in the appearance of those dotted “lines” in the bottom left of the graph.
The more loose cluster in the top part are the panels that vary in their number of characters with more than 2. When you only look at these panels that have multiple characters (more than 2) in them, this relationship to size disappears, or even slightly reverses!
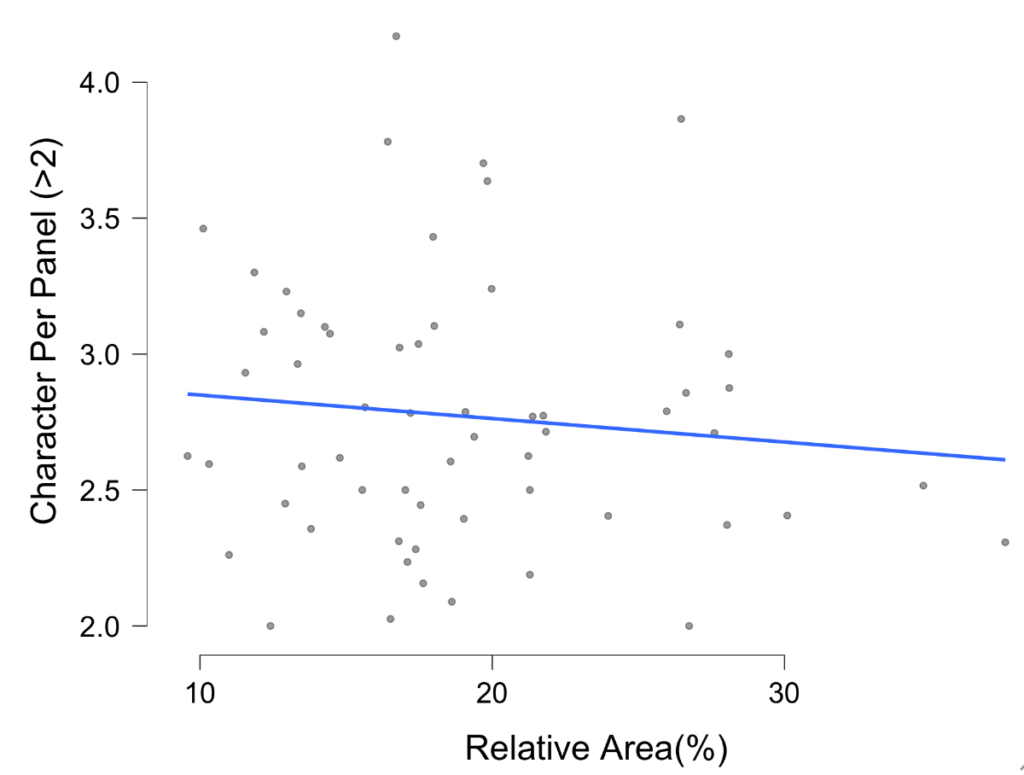
So, it seems panel sizing isn’t motivated by panels with lots of characters being larger, but by panels with one or fewer characters being relatively smaller.
These are the interesting and exciting things that MAST lets us explore. We’re excited to share more soon, and to eventually make MAST and our data available for everyone.
Comments